The distribution of species depends on numerous biotic and abiotic factors. Knowing them is key to knowing where the different living beings will be distributed around the globe. With that in mind, we want to tell you about biodiversity distribution maps.
Biodiversity distribution maps are tools that allow biologists to describe the patterns of distribution of living beings on the planet. Knowing the habitats of species is key to their conservation. Elaborating them requires taking into account an enormous amount of factors.
How are distribution maps made and according to what criteria? What factors make species live where they do? We’ll answer all these questions in the following lines.
Biodiversity distribution: Factors that affect it
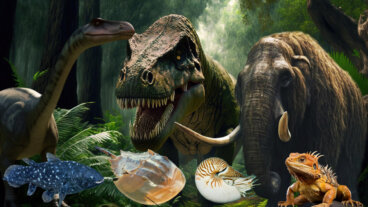
The diverse species of animals and plants that inhabit our planet have different vital requirements. Some species like cold sites in the polar areas. Other animals, on the other hand, prefer the conditions of extreme humidity and high temperature of the equatorial forests, as is the case with the orangutan.
The set of biotic and abiotic requirements that a species has for its survival are what we call an ecological niche. An ecological niche is the set of factors in which a species feels comfortable, that is, its optimal living conditions.
This ecological niche is modeled mainly by conditions of temperature, humidity, soil type, and other environmental parameters. These are all abiotic factors. As for biotic factors, animals need to live wherever they can find food and have little competition for the same type of resources.
A world map with the critical points of biodiversity.
General patterns of biodiversity distribution
Once we’ve explained the distribution of species, we can emphasize a series of generalities about biodiversity distribution at a terrestrial level.
A very important phenomenon concerning this issue is the latitudinal gradient of biodiversity. In general terms, this indicates that biodiversity is greater around the equator. Then, it decreases little by little as we approach the poles, with the exception of the deserts.
This is due to the fact that the equator is the most suitable location for an enormous number of species. This is because of its high temperatures, solar radiation, and high relative humidity. This promotes the appearance of more vegetation, which usually means more animals.
In general, warmer and more humid places tend to support greater biodiversity than cold and dry places. This is because plants, which are the foundation of the food pyramid, tend to grow better in these conditions.
The making of biodiversity distribution maps
Originally, mapping the distribution of animal species involved conducting arduous censuses where species were known to exist. In these cases, researchers counted individuals and estimated their distribution. This began in the 17th century when the first naturalists began to describe and count the species they found.
Today, the techniques have improved a lot and are based on mathematical models. Certain statistical programs spatially model the ideal conditions for a particular species for each factor. By putting all these maps together where factors are ideal, researchers obtain a map of where the species are most likely to live.
Biodiversity maps: Counting the number of species
We’ve already talked about species distribution maps, but now we’ll look at another type of map: biodiversity maps. That is, those that measure the number of species per area. These maps allow us to know where there are more species.
These maps are divided into regular units (a grid), where the number of species present is counted. So, they help to determine which areas are richest in biodiversity, and where to establish protected areas.
Let’s say, for example, that in a mountainous area, we have 4 tiles with 25 species of amphibians. In this case, relevant authorities will consider protecting this area from others for the conservation of this taxonomic group. However, money is limited and sometimes you have to choose.
Uses of biodiversity distribution maps
In conclusion, Biodiversity distribution maps are an excellent tool for finding out where species live and what ecological niche they occupy. Therefore, they can be very important in conservation efforts to know which areas could need protection from degradation.
Biodiversity maps in the strict sense – indicating the number of species – are tremendously useful for cataloging areas where there’s a lot of biodiversity and need protection. On the other hand, thanks to these documents, experts can establish specific action plans for areas with little biological diversity.
Biodiversity distribution maps are tools that allow biologists to describe the patterns of distribution of living beings on the planet. Knowing the habitats of species is key to their conservation. Elaborating them requires taking into account an enormous amount of factors.
How are distribution maps made and according to what criteria? What factors make species live where they do? We’ll answer all these questions in the following lines.
Biodiversity distribution: Factors that affect it
The diverse species of animals and plants that inhabit our planet have different vital requirements. Some species like cold sites in the polar areas. Other animals, on the other hand, prefer the conditions of extreme humidity and high temperature of the equatorial forests, as is the case with the orangutan.
The set of biotic and abiotic requirements that a species has for its survival are what we call an ecological niche. An ecological niche is the set of factors in which a species feels comfortable, that is, its optimal living conditions.
This ecological niche is modeled mainly by conditions of temperature, humidity, soil type, and other environmental parameters. These are all abiotic factors. As for biotic factors, animals need to live wherever they can find food and have little competition for the same type of resources.
A world map with the critical points of biodiversity.
General patterns of biodiversity distribution
Once we’ve explained the distribution of species, we can emphasize a series of generalities about biodiversity distribution at a terrestrial level.
A very important phenomenon concerning this issue is the latitudinal gradient of biodiversity. In general terms, this indicates that biodiversity is greater around the equator. Then, it decreases little by little as we approach the poles, with the exception of the deserts.
This is due to the fact that the equator is the most suitable location for an enormous number of species. This is because of its high temperatures, solar radiation, and high relative humidity. This promotes the appearance of more vegetation, which usually means more animals.
In general, warmer and more humid places tend to support greater biodiversity than cold and dry places. This is because plants, which are the foundation of the food pyramid, tend to grow better in these conditions.
The making of biodiversity distribution maps
Originally, mapping the distribution of animal species involved conducting arduous censuses where species were known to exist. In these cases, researchers counted individuals and estimated their distribution. This began in the 17th century when the first naturalists began to describe and count the species they found.
Today, the techniques have improved a lot and are based on mathematical models. Certain statistical programs spatially model the ideal conditions for a particular species for each factor. By putting all these maps together where factors are ideal, researchers obtain a map of where the species are most likely to live.
Biodiversity maps: Counting the number of species
We’ve already talked about species distribution maps, but now we’ll look at another type of map: biodiversity maps. That is, those that measure the number of species per area. These maps allow us to know where there are more species.
These maps are divided into regular units (a grid), where the number of species present is counted. So, they help to determine which areas are richest in biodiversity, and where to establish protected areas.
Let’s say, for example, that in a mountainous area, we have 4 tiles with 25 species of amphibians. In this case, relevant authorities will consider protecting this area from others for the conservation of this taxonomic group. However, money is limited and sometimes you have to choose.
Uses of biodiversity distribution maps
In conclusion, Biodiversity distribution maps are an excellent tool for finding out where species live and what ecological niche they occupy. Therefore, they can be very important in conservation efforts to know which areas could need protection from degradation.
Biodiversity maps in the strict sense – indicating the number of species – are tremendously useful for cataloging areas where there’s a lot of biodiversity and need protection. On the other hand, thanks to these documents, experts can establish specific action plans for areas with little biological diversity.
All cited sources were thoroughly reviewed by our team to ensure their quality, reliability, currency, and validity. The bibliography of this article was considered reliable and of academic or scientific accuracy.
Morales-Castilla, I., & García-Valdés, R. (2014). Gradientes latitudinales de diversidad inversos,¿ excepciones que prueban la regla?. Revista Ecosistemas, 23(1), 4-12.
Illoldi-Rangel, P. A. T. R. I. C. I. A., & Escalante, T. A. N. I. A. (2008). De los modelos de nicho ecológico a las áreas de distribución geográfica. Biogeografía, 3, 7-12.
This text is provided for informational purposes only and does not replace consultation with a professional. If in doubt, consult your specialist.